 |
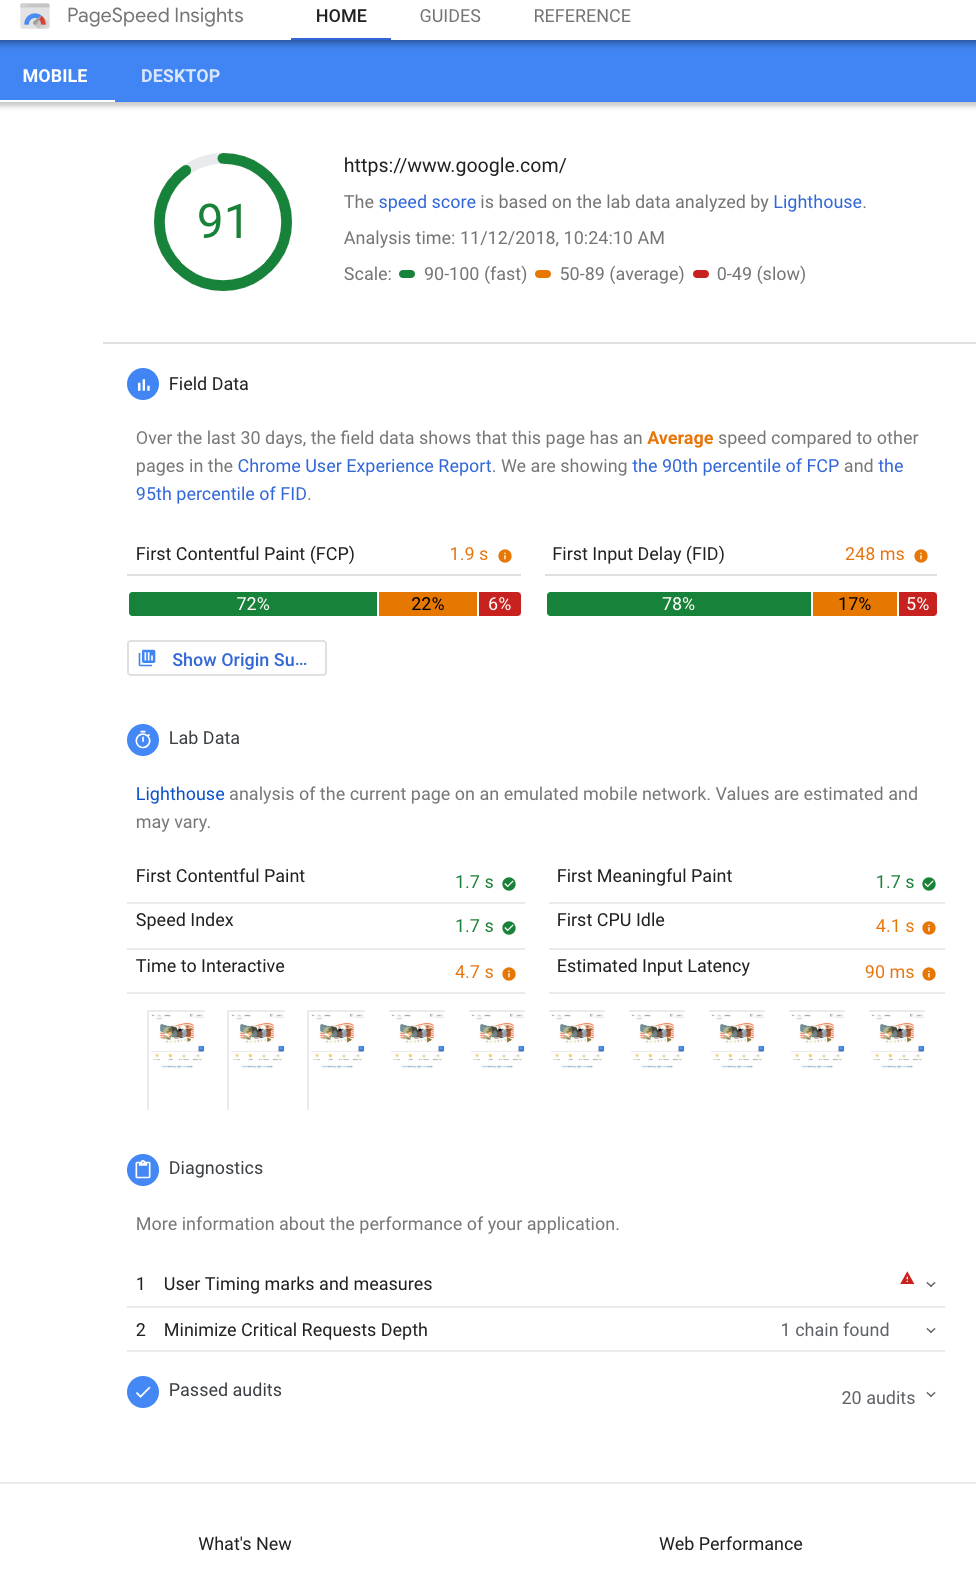
| Pagespeed Insights is now powered by Lighthouse |
PageSpeed Insights provides the following information:
- Lab Data. PSI fetches and analyzes the page using Lighthouse, which simulates how a mobile device loads a page. It computes a set of performance metrics for the page (such as First Contentful Paint and Time to Interactive) and summarizes these metrics with a performance score from 0-100. Scores are categorized into three levels; 90 and up is considered to be a good score.
- Field Data. PSI also displays real-world performance metrics (First Contentful Paint and First Input Delay) for the page and its origin. (As a result, we've also deprecated the origin: query in PSI). Note that not all sites may have field data available for display. The data set relies on a version of the Chrome User Experience Report that is updated daily and is aggregated over the previous 28 days. Keep in mind that the metrics

